Design, Prototypical Development and Usability Testing of a Visuospatial Neglect Training Application on a Touch Table
Aim and Research Question(s)
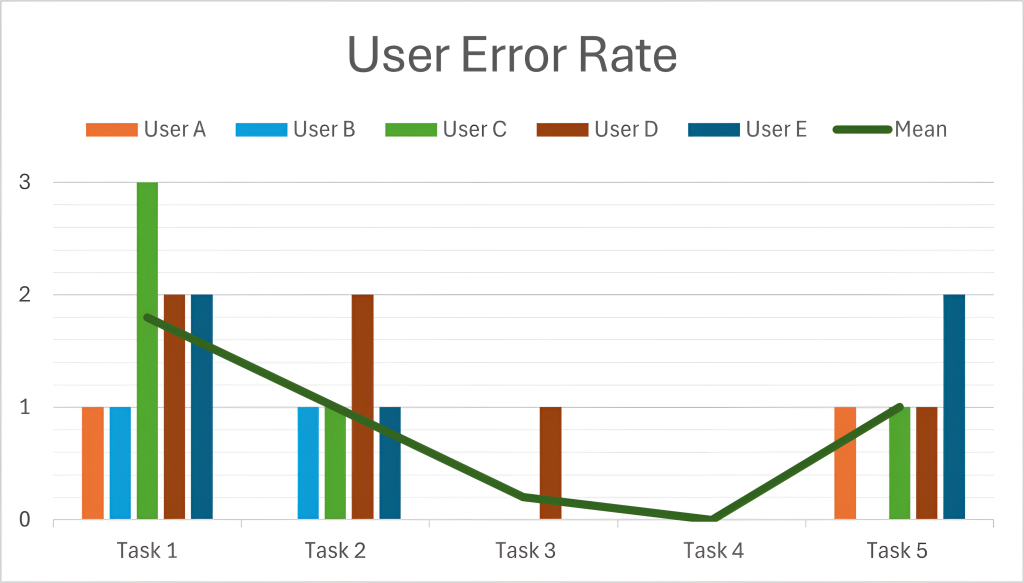
The aim of this work is to develop and design a prototype for the evaluation and training of a visuospatial neglect and subsequently analyse it using a usability test. RQ 1: What are requirements in detecting and quantifying visuospatial neglect in stroke patients identified by occupational therapists? RQ 2: What functional and technical requirements are essential to develop a touch-based interface for a collaborative setting in occupational therapy with patients with visuospatial neglect? RQ 3: What are the Task Completion Rate, the Time on Task and the User Error Rate as UX metrics testing a prototype for the evaluation of visuospatial neglect using a touch table application including occupational therapists?
Background
Approximately 12.2 million new strokes are documented worldwide every year [1]. 30% of all these strokes are accompanied by symptoms of visuospatial neglect [2]. Currently, assessment and therapy are largely performed using paper and pencil tasks that are rarely archived.
Methods
Usability testing was carried out in accordance to the user-centred design process [3]. At the beginning  of the project, an extensive literature review as well as an intervie with two experts was carried out to evaluate current needs in this area. These findings were implemented in the development and design of such a prototype. The testing was carried out with five occupational therapists from the neurological field. A test scenario was carried out in which three different metrics were recorded. An interview was conducted to evaluate the user-friendliness.
Results and Discussion
- Importance of user-friendliness was mentioned by all participants
- Device can be used independently within few minutes while the user error rate additionally decreases

- Ability to custumize the device regarding assessments and training tools as well as hardware components
- Influence of environment must be considered: incidence of light and noise interference
Conclusion
The integration of a touch table for neglect treatment into everyday clinical practice is recommended, taking into account the adaptability of the table and the external conditions.
References
- V. L. Feigin et al., ‘World Stroke Organization (WSO): Global Stroke Fact Sheet 2022’, SAGE Publications, pp. 18–29
- E. Esposito, G. Shekhtman, and P. Chen, ‘Prevalence of spatial neglect post-stroke: A systematic review.’, Ann Phys Rehabil Med, vol. 64, no. 5, Sep. 2021
- J. Rubin and D. Chisnell, Handbook of Usability Testing: How to Plan, Design, and Conduct Effective Tests. John Wiley & Sons, 2008.