
INTRODUCTION
Chronic obstructive pulmonary disease (COPD) is characterized by progressive, non-reversible air flow obstruction (Giardino, Chan, & Borson, 2004). Although the smoking is a leading factor in the development of COPD, other factors, such as environmental cannot be excluded (Giardino et al., 2004). It is well established that in rehabilitation process next to smoking cessation, pharmacological treatment and oxygen therapy, the physical activity plays important role i.e. breathing dynamic mostly (Society, 1995). The parameters of heart rate variability (HRV) have demonstrated strong utility in clinical practice and they honestly reflect the activity of autonomic nervous system (ANS). Furthermore, ANS is a good indicator of any disturbance of physiological or psychological homeostasis. The measurement and assessment of HRV can be very easily performed nowadays due to continuous improvement in wireless technologies and computer programs (software/applications) (Bojan Makivic & Bauer, 2015).
Most recently, the HRV based Biofeedback system was used in patients with COPD in order to increase autonomic control of cardiopulmonary function (Giardino et al., 2004). Respiratory sinus arrhythmia (RSA), which refers decrease and increase in heart rate (HR) with inspiration and expiration, respectively, as well as oxygen saturation have been demonstrated to be lower in patients with COPD than in age/gander matched healthy controls (Pagani et al., 1996; Volterrani et al., 1994). Reduced RSA found in COPD patients can be explained with impaired pulmonary function. Accordingly, the monitoring of breathing dynamic and RSA next to the oxygen saturation will improve rehabilitation procedure in COPD patients.
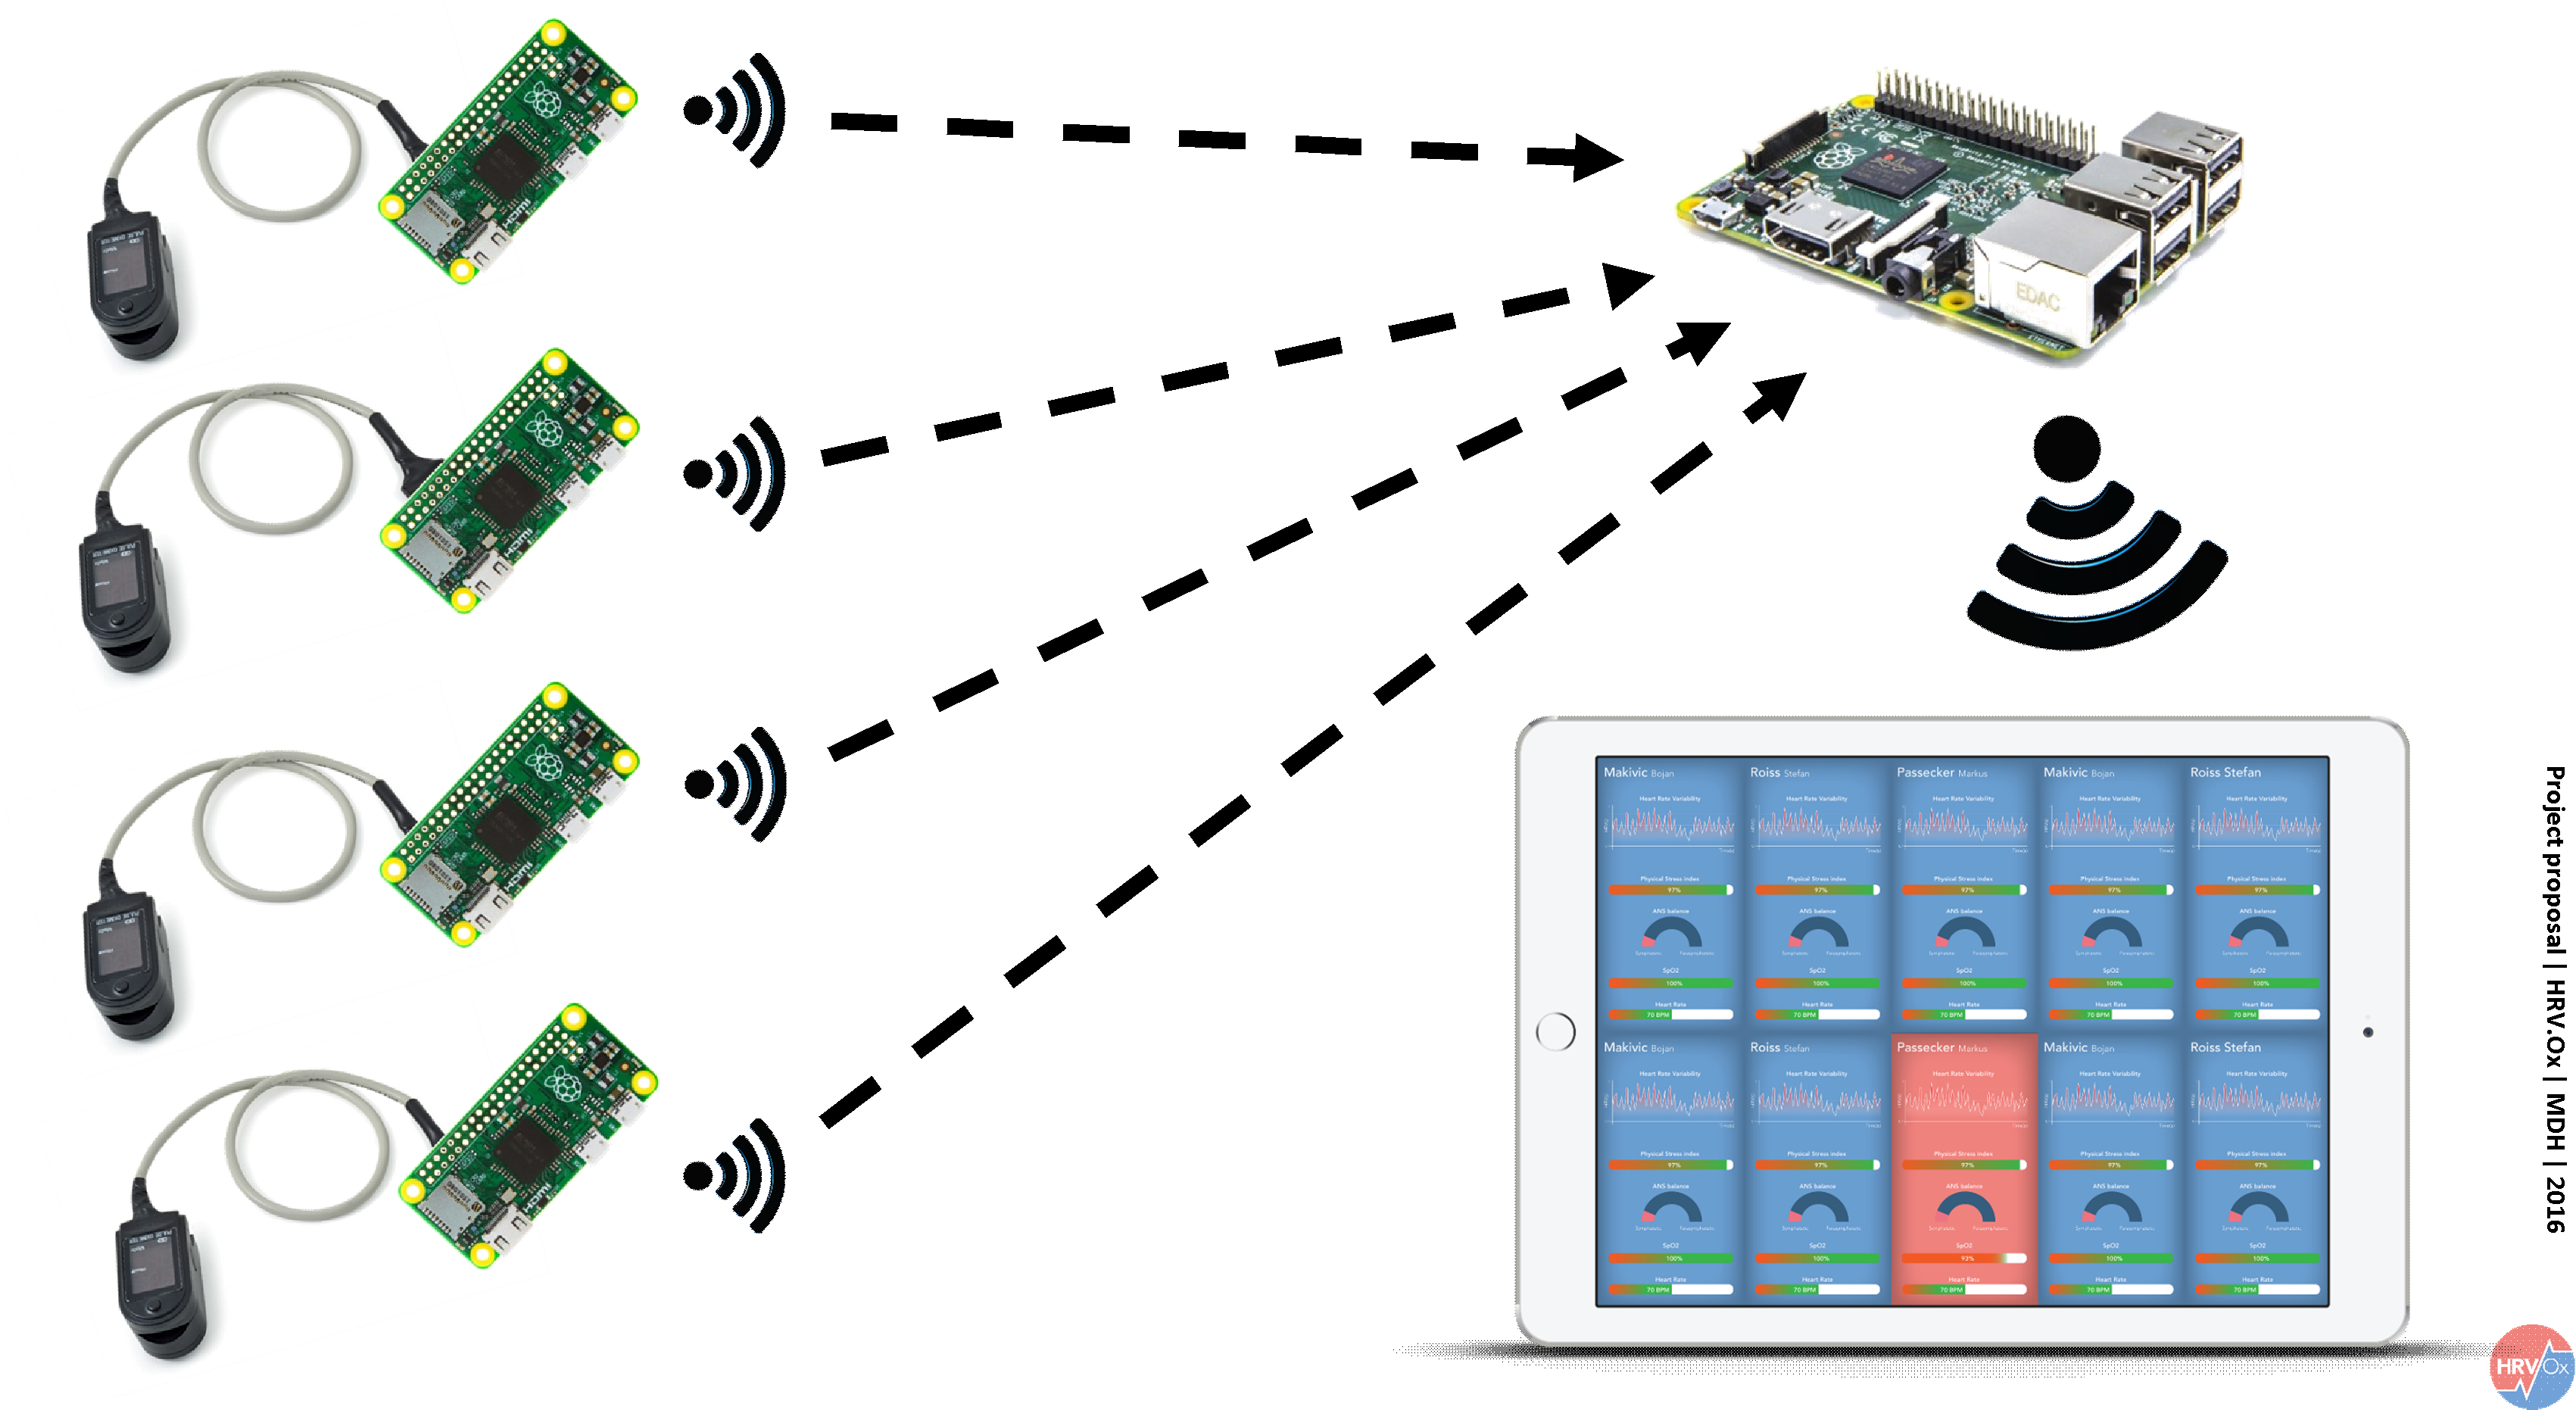
The main focus of the project is to develop system which can measure physiological parameters during the training in more subjects simultaneously and to visualize them in the real-time. Although some similar systems already exist none of them has demonstrated the possibility to measure HRV during the physical activity in the more subjects simultaneously.
SCENARIO
Helena (40) works now for 10 years in a Health Resort. This is a medical centre specialized in rehabilitation of patients with cardiovascular and pulmonary diseases. Helena works as coach and handles different sport groups. Although the sport medical support would be better in a one-to-one mentoring, there is not enough money for individual supervision. It’s difficult to focus on individual problems when you train in groups. Because of this specific problem we decided to create a solution for this.
So how does an average training session look?
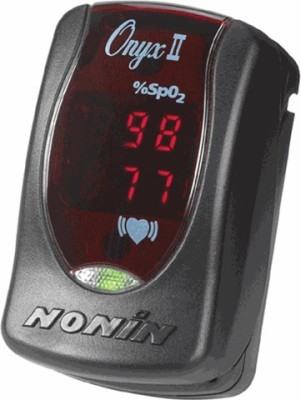
The patients come in groups of 8 people. One advantage of group training is the higher motivation of patients due to team spirit. They meet in an exercise room with bicycle ergometers, one for each patient. On these ergometers gentle endurance training is executed. Before they start everybody gets a monitoring device, attached by Helena. Helena is in charge of the group and guides it through training. Every single person gets a pulse oximeter to check the heart rate and the oxygen saturation before, while and after training. Helena gives instruction how to read the results of the oximeter so that everybody has at least basic knowledge to monitor their own vital parameters. This takes Helena a little time and some people, especially older people, don’t know what to do with this acquired knowledge. They accept it, but don’t use it.
Main advantage of our system: While the participants of this course are active on the bicycle ergometer, Helena gets their values of heart rate, heart rate variability and oxygen saturation directly on her tablet, in real time. She sees each of these values from every patient who is equipped with our special pulse oximeter. Every sport scientist or training therapist knows that physical activity with patients who have cardiovascular or pulmonary malfunctions is at high risk. This kind of training needs careful support and good supervision. Thanks to HRV.Ox Helena can interact with each of her patients in the exact moment when help or training advice is needed. So our system combines the advantages of group training (higher motivation, higher efficiency in terms of time and budget management) and individual training (individual care).
The participating patients strap off the oximeter after training and leave the exercise room with confidence, after a personalized training experience.
STATE OF ART
STRESSLOCTOR
SYMPLEEYE
OBJECTIVES
This novel concept is aimed to improve and easy a training process during rehabilitation of the patients diagnosed with chronic obstructive pulmonary disease (COPD). The idea behind it is to use classical oximeter device which would be adjusted for the purpose of heart rate variability (HRV) measurement and analysis as well. In order to observe different parameters (time/frequency domain HRV parameters and oxygen saturation) from few or more patients in the real-time simultaneously the HRV oximeter device will require Bluetooth connection with smartphone and development of adequate smartphone application. The significant challenge will be to overcome and to reduce a signal disturbance (mostly of motion artefacts) during recording obtained with a photoplethysmography (PPG).
In the following section we will define aims and non-aims of the project.
AIMS:
- Integrating HRV analysis in pulse oximeter device
- Incorporating different HRV indices in analysis in order to optimally reflect the stress level of subjects during the training
- Finding a solution to connect more devices in the same time
- Developing an application which will receive, analyze and store the data of several devices simultaneously
- Visualization and management of the data
- Possibility to integrate different informational tools which could notify visually or auditory a therapist or trainer about certain physiological border lines (high heart rate, high stress level and low oxygen saturation)
NON-AIMS:
- To use a separate system for receiving a heart rate signal (heart rate belts, ECG…)
- To receive and analyze a signal from only one person at the time
SCIENTIFIC APPROACH TO THE PROBLEMATIC
RESEARCH QUESTIONS
In order to better understand a current stand point in the field of HRV analysis through photoplethysmography (PPG) technology we have formulated several research questions which have to be optimally answered:
- Is it possible and reliable to use photoplethysmography technology in order to record the peak-to-peak variations in heart rhythm?
- What are the optimal steps in order to develop a real-time heart rate variability and oxygen saturation monitoring system for a group of COPD patients during rehabilitation?
- What would be optimal technology to use in terms of sensor, signal transaction and visualisation of data?
- What is target population whom this product would be designated for?
REASARCH METHODOLOGY
After the formulation of the research questions, the PICO strategy stages were used as a template for bibliographic search of relevant evidence, which consider usage of PPG for HRV analysis.
The PICO strategy has been used to describe all the components related to the identified problem and to structure the research questions. In the Tab 1 the corresponding PICO strategy for this project has been presented.
|
Acronym |
Definition |
Description |
|
P |
Patient or problem |
All population groups. Photoplethysmography technology used to analyse HRV |
|
I |
Intervention |
Smartphones camera, pulse oximeters . . . |
|
C |
Control or comparison |
ECG analysis of HRV, wrist monitors. |
|
O |
Outcome |
Reliability and accuracy of photoplethysmography derived HRV analysis |
Tab. 1: PICO strategy used to formulate research question and for following search optimization of relevant research literature
TECHNOLOGICAL APPROACH
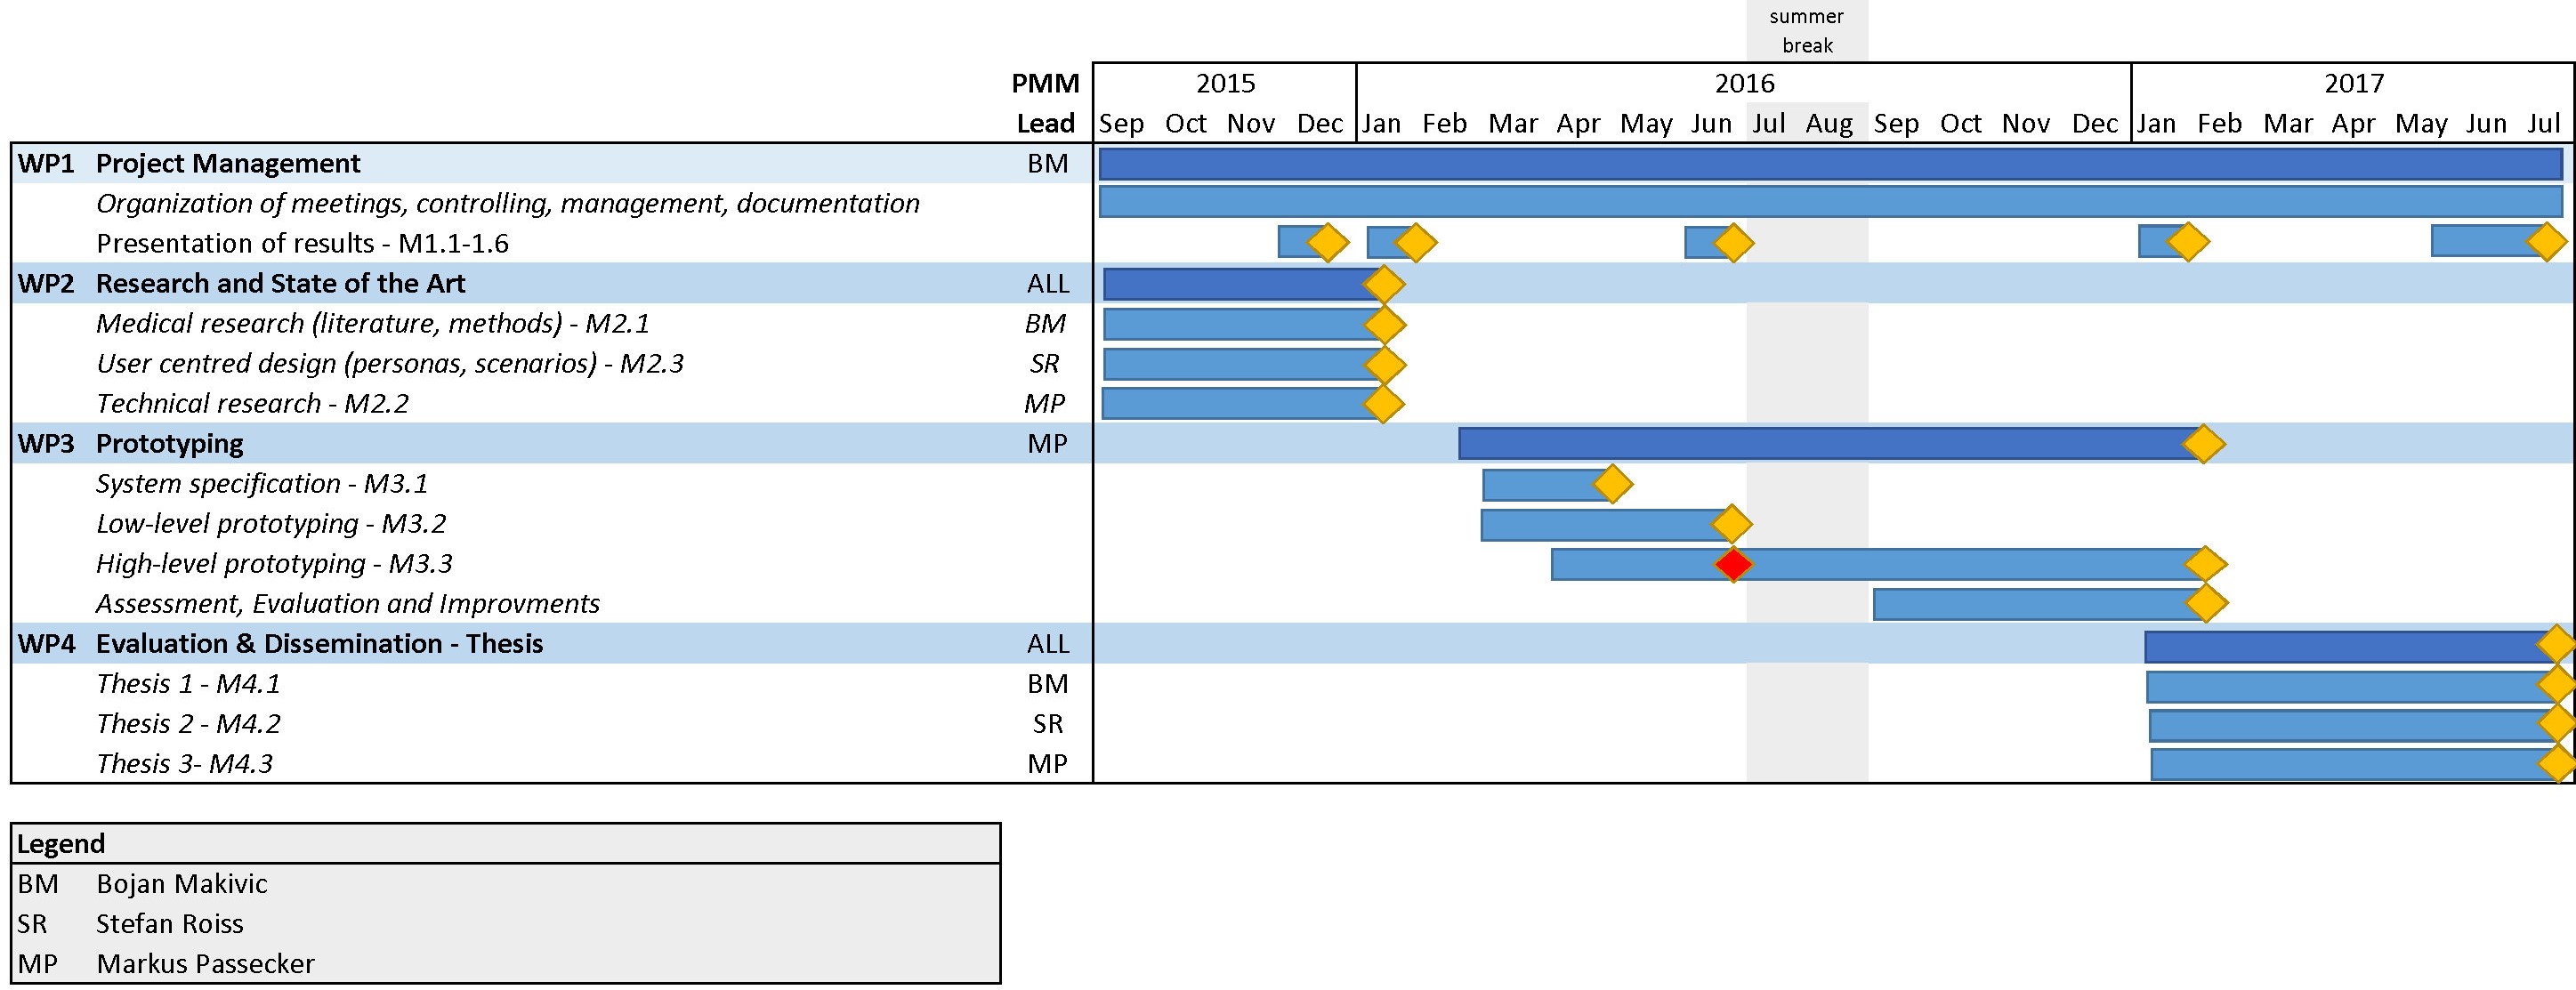
WORK PACKAGES
RISK ASSESSMENT
Every project is important and every project has its own risks. In general project risk analysis is the identification and quantification of the likelihood and impact of events that may impair the project (Cartriona Norris, John Perry, & Simon, 2000).
Risk analysis is in most cases divided in two stages:
- Qualitative analysis
- Quantitative analysis
For the purpose of this project the identification and subjective assessment of risks is evaluated with the mean of qualitative analysis.
Qualitative analysis
The main risk sources or factors have been identified and enlisted in the Risk Assessment check list. Every item in the risk assre to successfully extract RR intervals (or pulse to pulse intervals) from pulse oximeter.
Risk Assessment Check List
|
Risk |
Explanation |
Risk level |
|
R to R peak (RR) |
Possible failure to successfully extract RR intervals (or pulse to pulse intervals) from pulse oximeter. |
Low |
|
Funding requirements for the project |
Lack of sufficient financial support for the different phases of the project. |
Low |
|
Breakdown of team |
Possibility that one or more members left a team. |
Low |
|
Securitization of data |
Complete or partial loss of data and documents from computer, DropBox or other servers and web platforms. |
Low-Medium |
|
Deadlines and schedules |
Managing deadlines and schedules: |
Medium-High |
TECHNICAL ACCOMPLICHMENTS
HIGH LEVEL PROTOTYPING (Current status)
Currently we are still in the process of the high-level prototype. In the following we will describe the current state of the prototyping process.
Overview of the current state of the prototype
Our current prototype is based on the following hard- and software components and technologies. On the hardware side we currently use two Bluetooth pulse oximeters, one smartphone for each pulse oximeter, a server and a client (tablet computer/PC). We developed an application for the smartphones to read the biometric data of the pulse oximeters via Bluetooth LE and send the data through a web socket connection to a Node.JS server. The server collects the data of all sensors and sends it to a monitoring application which displays the data in real-time. In the following we will describe the essential hardware and software part of the current prototype.
Berry Bluetooth pulse oximeter
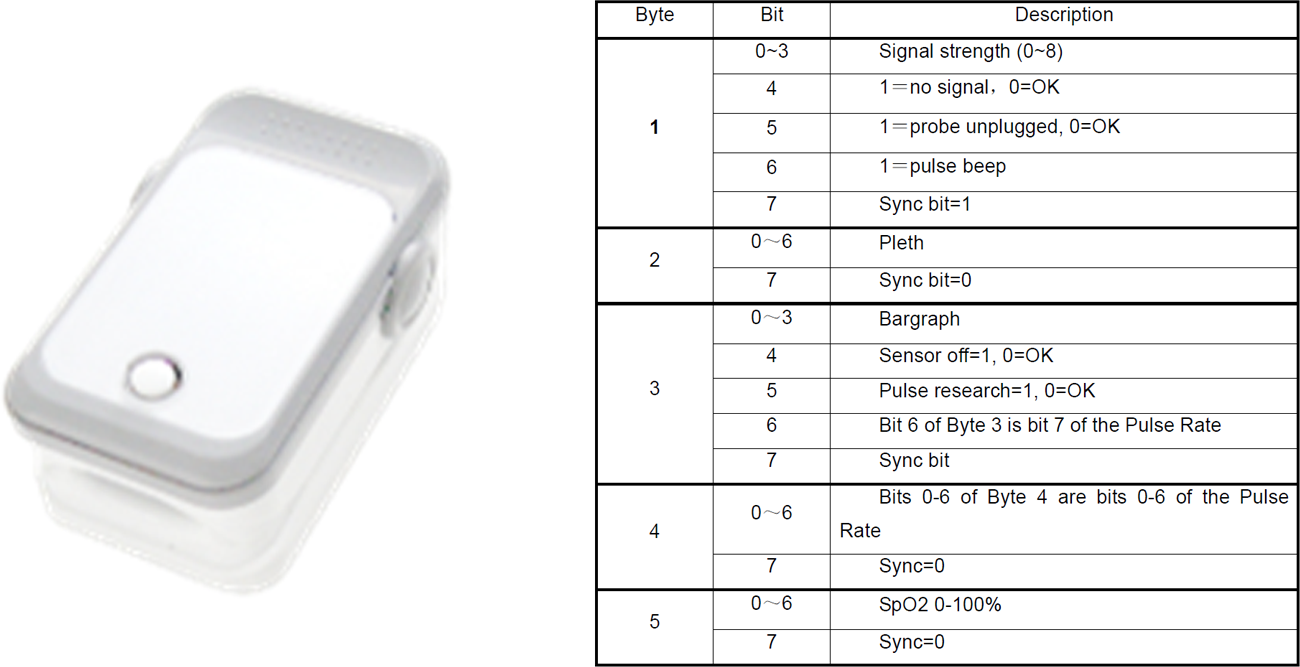
Our primary sensor for the prototype is the “OEM SPO2 Pulse Meter” developed by Shanghai Berry Medical Electronic Co. Ltd. The sensor sends the biometric data via Bluetooth and provides a BCI communication protocol for developers .
Software development
The development of both applications is based on web technologies. We used the open-source mobile development framework Apache Cordova (https://cordova.apache.org/) combined with the IONIC SDK (http://ionicframework.com), an open-source mobile software development kit for developing native and progressive web apps.
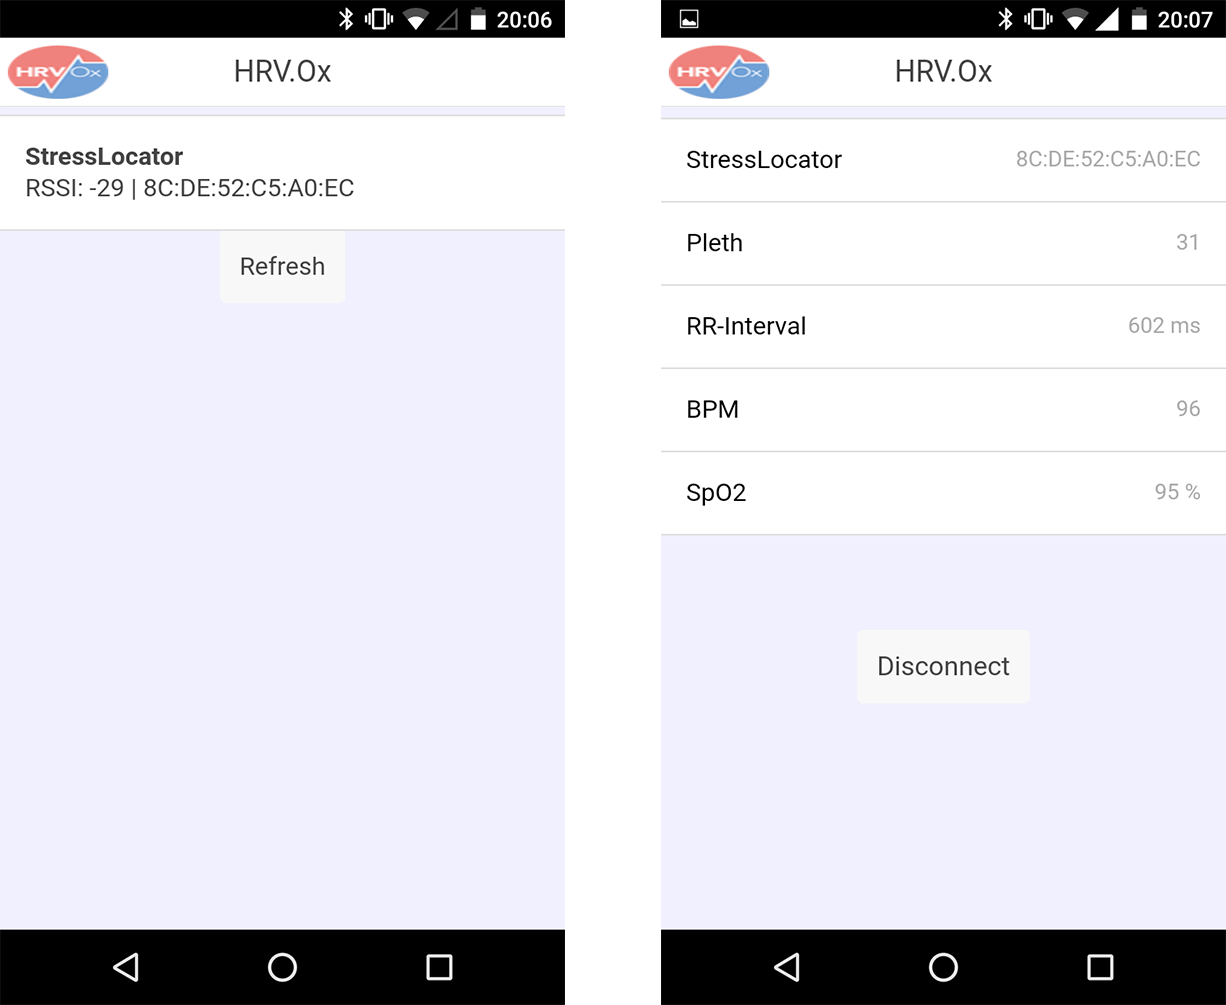
Smartphone application
The main purpose of the application for an Android smartphone is to collect the data from one pulse oximeter and send it to the Node.JS server. For this purpose, we developed a simple application with no special focus on a rich user-interface. In the figure 8 are presented the two screens of the smartphone app.
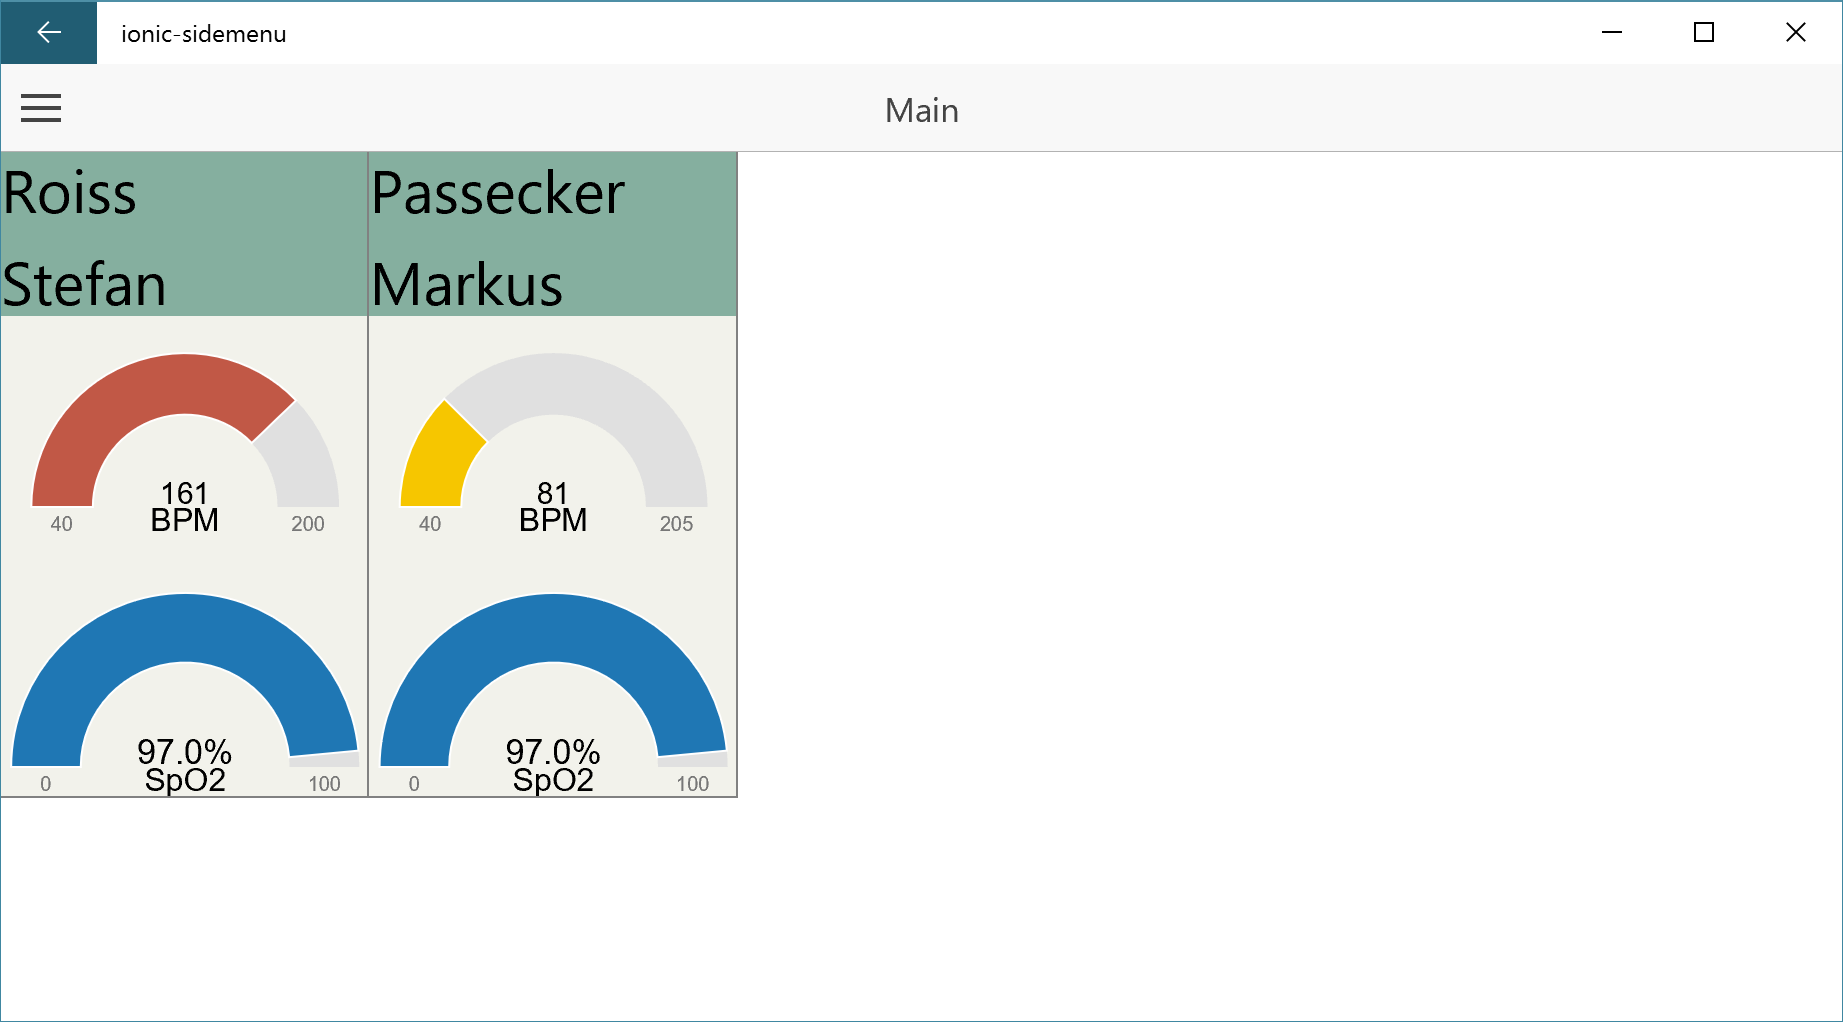
Tablet/PC monitoring application
To show and display the data of all connected pulse oximeters we developed an application using the same Tools and Technologies we used for the smartphone application. In the current state we can display the data of two pulse oximeters. The application collects the data of connected devices and displays them in real time using Gauge charts.
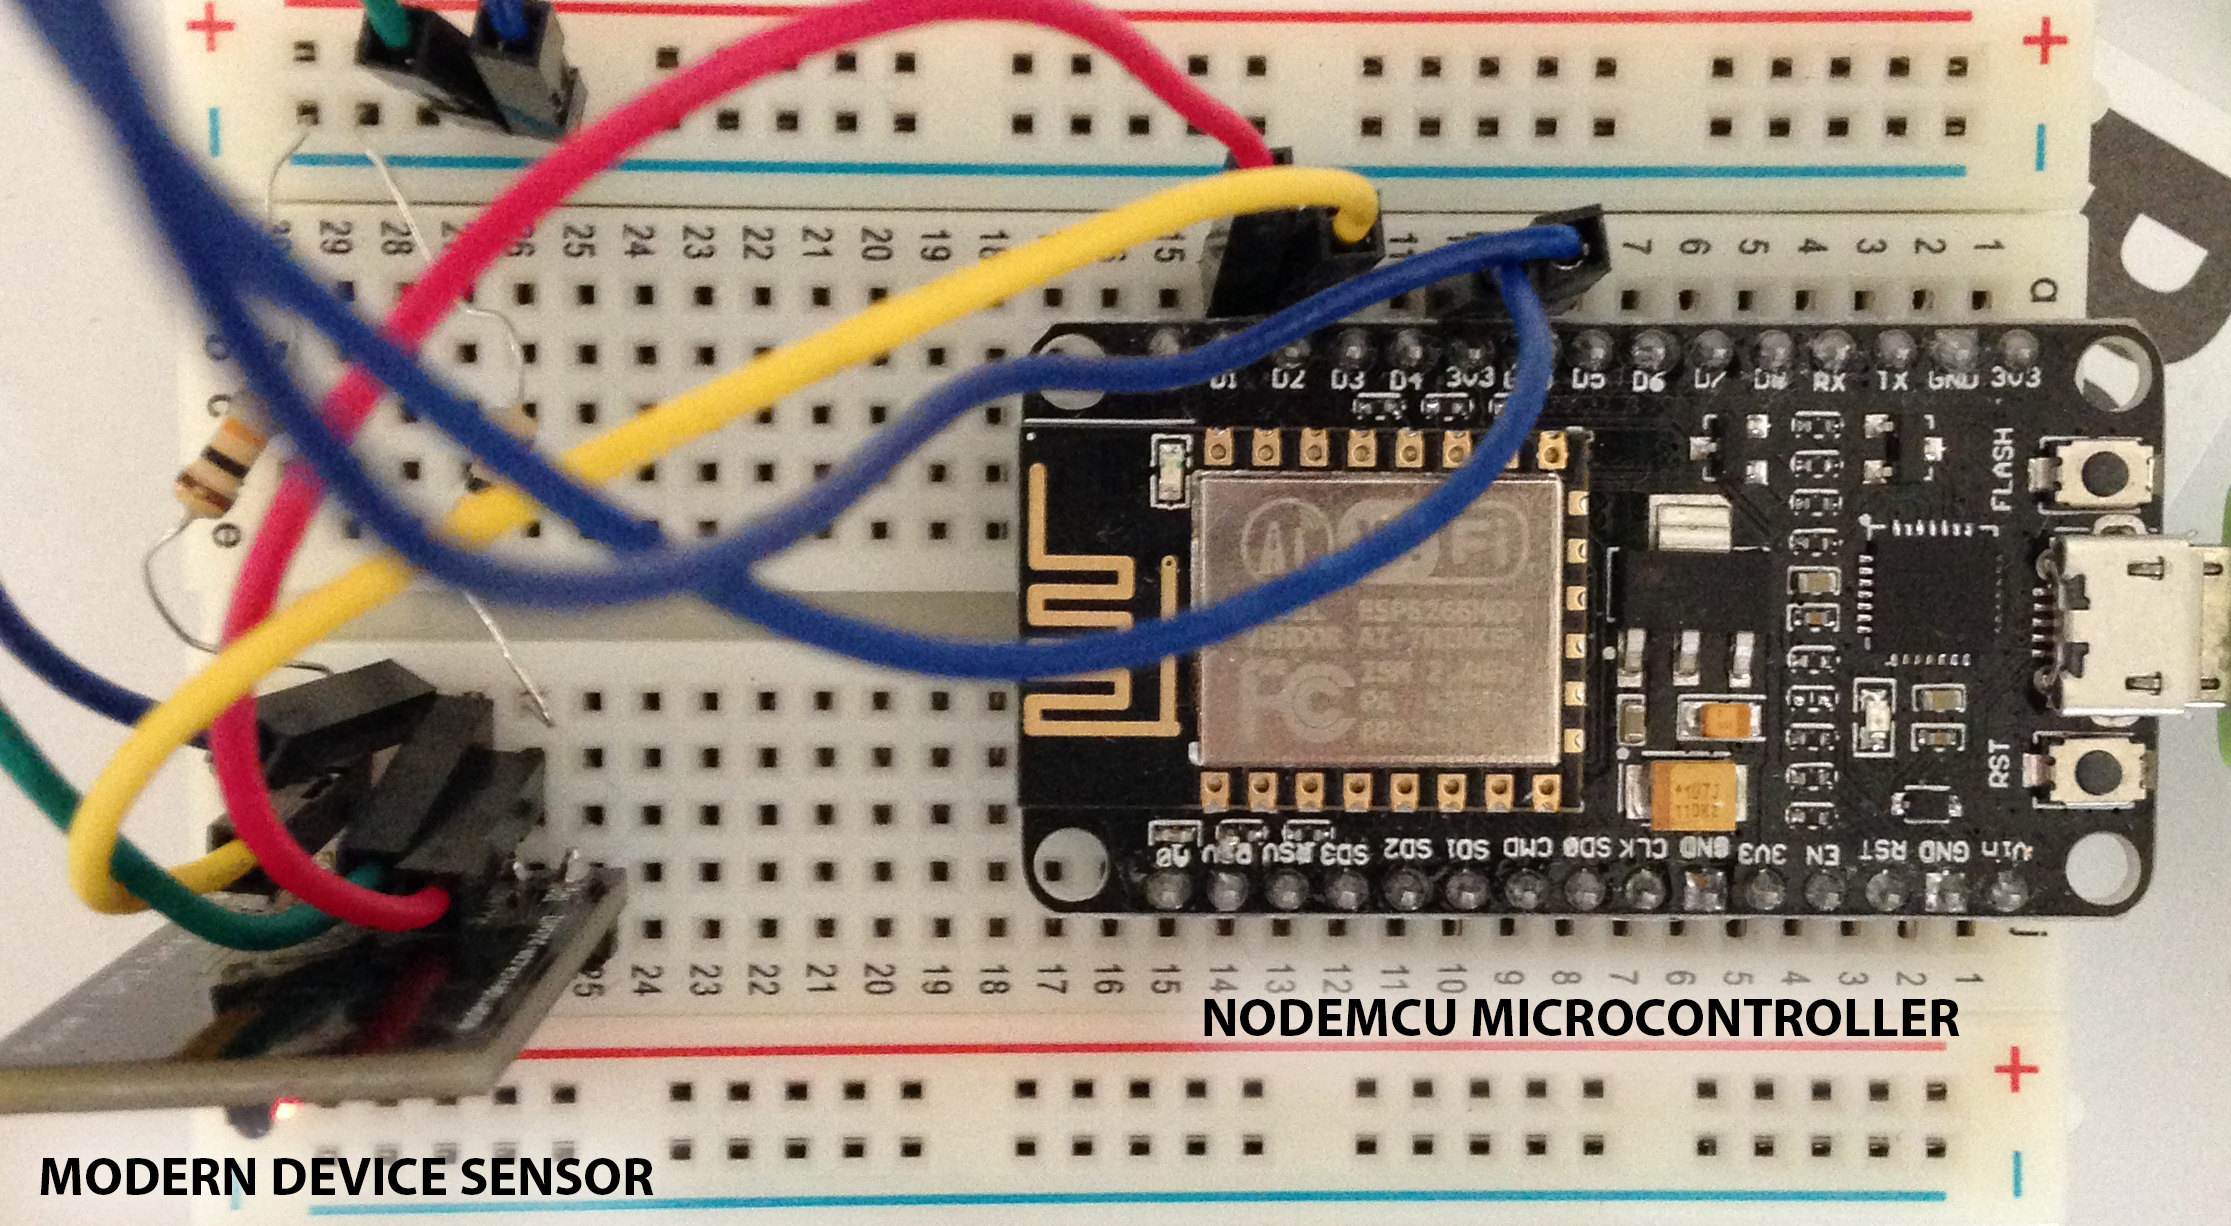
Sensor development – Modern Device Sensor and NodeMCU
In addition to the Bluetooth pulse oximeters we developed an additional pulse oximeter using a reflective pulse/heartbeat sensor (https://moderndevice.com/product/pulse-heartbeat-sensor/) and a WIFI microcontroller NodeMCU (http://nodemcu.com/index_en.html). The WIFI microcontroller allows us to send the biometric data directly to the Node.JS server without the need of a smartphone. The development of this sensor is still in progress but we are planning to use it during the evaluation of our project to compare it with the Berry pulse oximeter.
Evaluation and Optimization in Digital Healthcare
Hrate analysis (HRV) and comparison between H7 polar HR belt and modern device PPG sensor
The HRV analysis was recorded simultaneously with Polar H7 hear rate belt and pulse/heartbeat sensor (modern device). The analysis of raw beat-to-beat (RR) data has been performed with Kubios 3.0 software for advanced HRV analysis and reports for both devices were exported (Figure below).
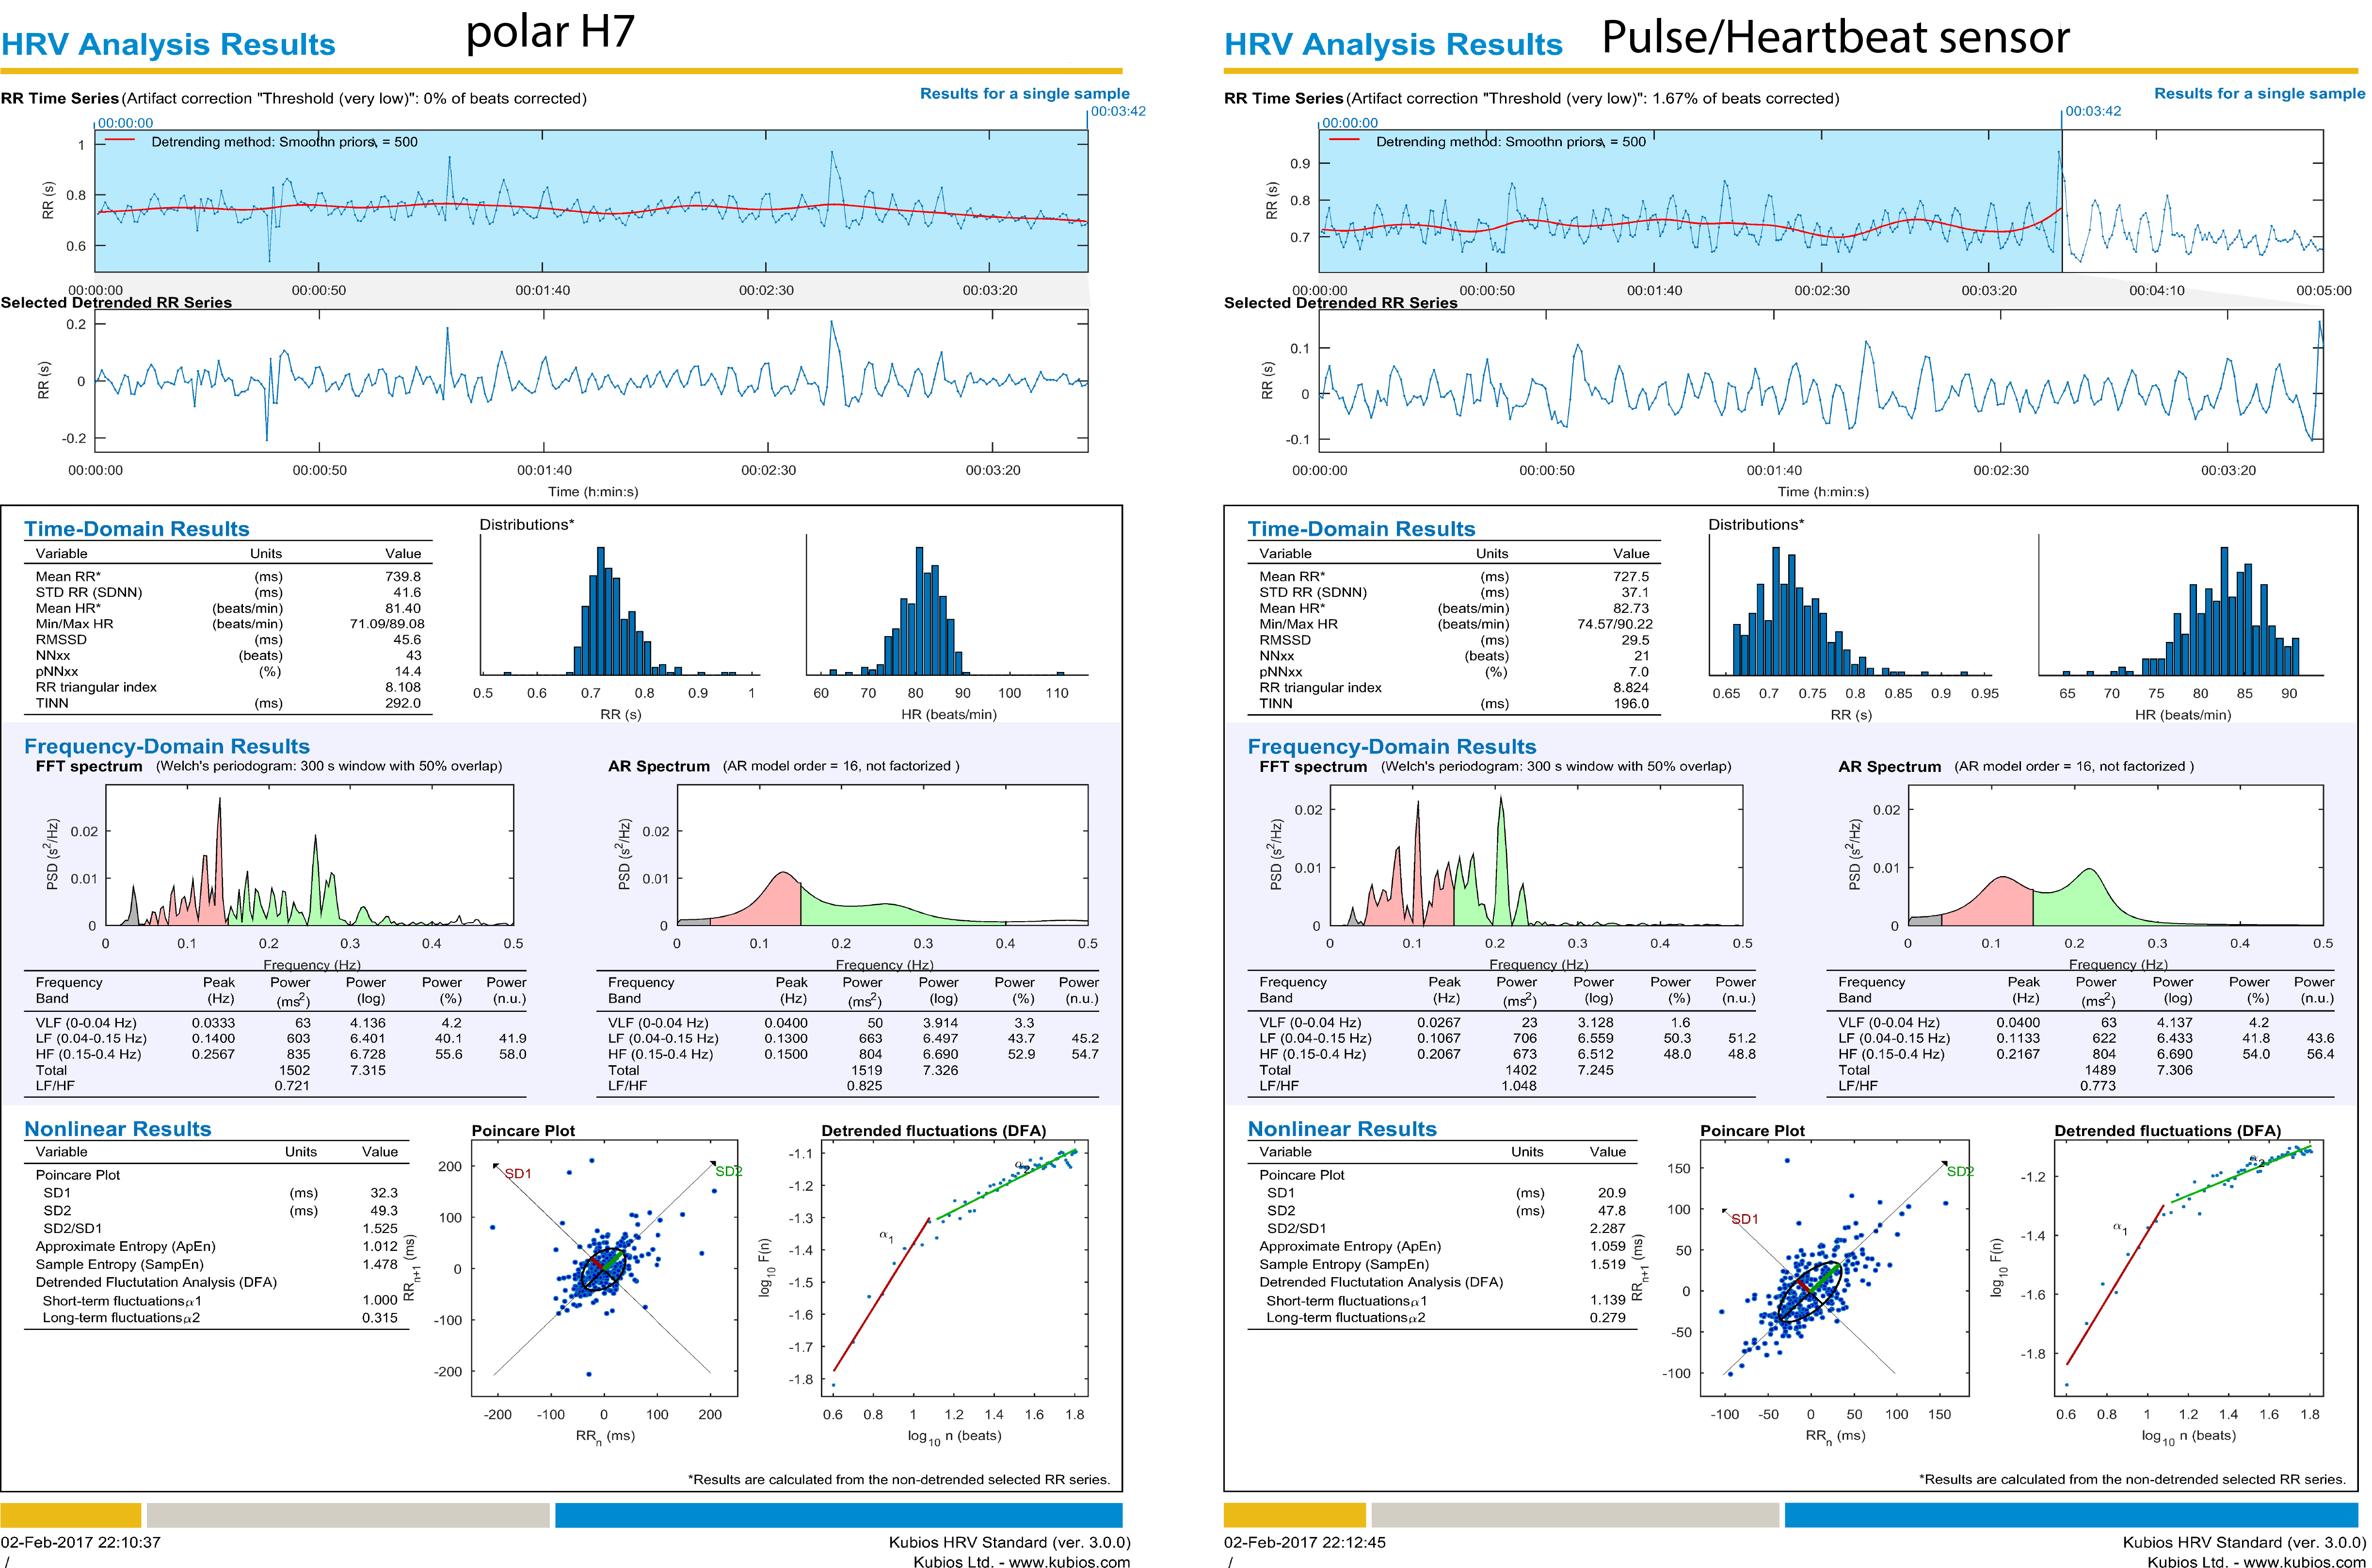
Kubios HRV analysis report for Polar H7 and Pulse/Heartbeat sensor
The raw RR data were exported in Excel sheet and stored in .txt files as values in milliseconds (ms) for further HRV analysis. For the corresponding HRV we have captured a five minutes of RR data which is in accordance with scientific literature.
The table 1 outlines the basic HRV parameters for time-domain, frequency-domain and non-linear (Poincare plot) analysis.
| HRV analysis of five minutes beat-to-beat intervals | ||
| Time domain | Polar H7 | ModernDevice |
| Mean RR (ms) | 739.8 | 727.5 |
| STD RR (SDNN) (ms) | 41.6 | 37.1 |
| RMSSD (ms) | 45.6 | 29.5 |
| Frequency domain FFT power (ms²) | ||
| LF (0.04-0.15 Hz) | 603 | 706 |
| HF (>0.15 Hz) | 835 | 673 |
| LF/HF | 0.721 | 1.048 |
| Frequency domain AR power (ms²) | ||
| LF (0.04-0.15 Hz) | 663 | 622 |
| HF (>0.15 Hz) | 804 | 804 |
| LF/HF | 0.825 | 0.773 |
| Non-linear (Poincare Plot) | ||
| SD 1 (ms) | 32.3 | 20.9 |
| SD 2 (ms) | 49.3 | 47.8 |
Bland-Altman analysis
To compare the different measurement methods, we performed a Bland-Altman analysis for the parameters heart rate, oxygen saturation and RR-intervals. Therefore, we tried to create pairs of values for each specific time stamp. As the sensors record with different frequencies we have a problem to synchronize the data. The reason for this, are the built-in filter mechanisms in Polar and Berry sensor. Whereas our Modern Device sensor sends the raw data, unfiltered data.
In order to fulfill the premises of a Bland-Altman analysis we need to verify a normal distribution in our data. As we look at the differences between our two methods, the figure below shows the distribution of differences in heart rate between Polar and Modern device sensor. The same procedure was used to determine normality in SPO2 and RR intervals.
REFERENCES
Bojan Makivic, & Bauer, P. (2015). Heart rate variability analysis in sport: Utility, practical implementation and future perspectives. Aspetar Sport Medicine Journal, 4(2).
Cartriona Norris, John Perry, & Simon, P. (2000). Project risk analysis and management.
Giardino, N., Chan, L., & Borson, S. (2004). Combined Heart Rate Variability and Pulse Oximetry Biofeedback for Chronic Obstructive Pulmonary Disease: Preliminary Findings. Applied Psychophysiology and Biofeedback, 29(2), 121-133. doi: 10.1023/b:apbi.0000026638.64386.89
Pagani, M., Lucini, D., Pizzinelli, P., Sergi, M., Bosisio, E., Mela, G. S., & Malliani, A. (1996). Effects of aging and of chronic obstructive pulmonary disease on RR interval variability. Journal of the Autonomic Nervous System, 59(3), 125-132. doi: http://dx.doi.org/10.1016/0165-1838(96)00015-X
Society, A. T. (1995). Standards for the diagnosis and care of patients with chronic obstructive pulmonary disease. American Thoracic Society. Am J Respir Crit Care Med, 152(5 Pt 2), S77-121.
Volterrani, M., Scalvini, S., Mazzuero, G., Lanfranchi, P., Colombo, R., Clark, A. L., & Levi, G. (1994). DEcreased heart rate variability in patients with chronic obstructive pulmonary disease. Chest, 106(5), 1432-1437. doi: 10.1378/chest.106.5.1432

