
Visual decision support in emergency response for Emergency Medical Technicians: Design, implementation and evaluation of a dashboard for major incidents
Aim and Research Question(s)
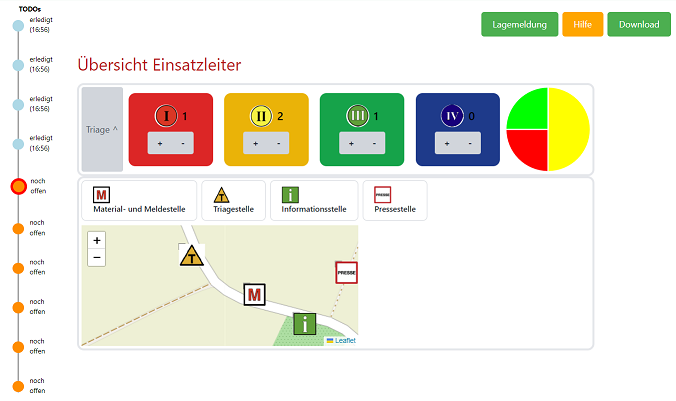
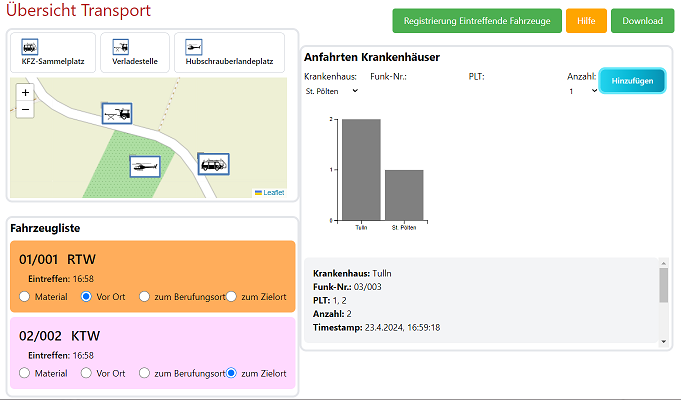
This work aims to develop an interactive dashboard for Emergency Medical Technicians during major incidents. The current analog paper based solution is compared to a digital dashboard for tablets tailored to assist operation and transport leaders with visual decision support. Two research questions were formulated:
- How can major incident data be visualized to be used by operation and transport leaders?
- How is the usability of the dashboard evaluated by Austrian Emergency Medical Technicians compared to the analog paper based clipboard?
Background
Information overload remains a significant obstacle faced during major incidents, which requires the creation of dashboards to assist users with data. An advantage of data visualization is that it enhances information delivery, therefore reducing the cognitive burden associated with decision-making (Nascimento et al., 2016; Park et al., 2021).
Methods
The Design Study Method is used as it focuses on understanding user needs, employing iterative design, prototyping, and evaluation. Expert interviews, Visualization Literacy Assessment Test (VLAT), d3.js and vue.js are used to create the dashboard. The evaluation was conducted with a user testing, expert interview and System Usability Scale (SUS).
Results and Discussion
- Mean SUS score = 82.5
- Four experts preferred the digital dashboard, two the analog clipboard, two liked to work with either
- Documentation of the example major incident was described as easier with the digital dashboard
- A cooperative dashboard is wished for by the experts
Conclusion
There is potential to support operation and transport leaders with decision making and situational awareness during major incidents by using interactive displays of documented information and data visualization.
References
Nascimento, B. S., Vivacqua, A. S., & Borges, M. R. S. (2016). A flexible architecture for selection and visualization of information in emergency situations. 2016 IEEE International Conference on Systems, Man, and Cybernetics (SMC). https://doi. org/10.1109/smc.2016.7844746 Park, S., Bekemeier, B., Flaxman, A. D., & Schultz, M. (2021). Impact of data visualization on decision-making and its implications for public health practice: a systematic literature review. Informatics for health and social care, 47(2), 175–193. https: //doi.org/10.1080/17538157.2021.1982949