Fall Risk Visualization: Comparing Time Bar and Time Spiral Plots for Interpretation of Periodic Events in Time Series
Aim and Research Question(s)
The aim of this master thesis is to gain insights on visualizations for supporting the interpretaion of fall risk events and trends by comparing time bar plots and time spiral plots. Differences are evaluated in terms of cognitive task load (NASA-TLX), accuracy, time and preferences. Furthermore experts are asked if time spiral and time bar plots could support fall risk event and trend interpretation.
Background
Fall risk is a relevant research field yet state of the art in fall risk assessment are based on patient or stuff reported scales or laboratory balance and walking tests [1]. Fall risk have a time-dependent pattern which repeat due chronobiology in a 24-hour pattern [2]. Therefore wearable devices and sensors could enrich the understanding of individual and time dependend fall risk factors. There is still a lack of user-centred design research of visualizations [3]. Whereas there are general recommendations for using 24h linear charts [4], there are also assumptions on the usefulness of spirals for identifying pattern changes and comparing periodical events [5].
Methods
For an user-centred design approach the target group and a scenario was derived from literatur, followed by the development of a time bar plot and time spiral plot (Figure 1). The preferences of four physiotherapists were analysed in an online qualitative questionnaire.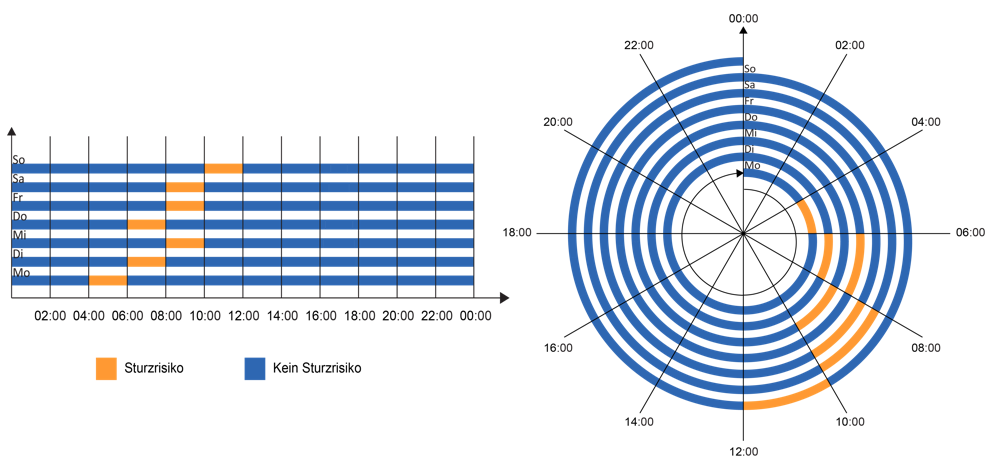 Figure 1. Time Bar Plot (left) and Time Spiral Plot (right) of Fall Risk Trend Interpretation Task.
A within subject’s cross-over pilot study (n = 22; m = 11; f = 11 and age = 29.3 ± 3.9 years) with fall risk event and trend interpretation tasks was conducted in an online quantitative questionnaire.
Figure 1. Time Bar Plot (left) and Time Spiral Plot (right) of Fall Risk Trend Interpretation Task.
A within subject’s cross-over pilot study (n = 22; m = 11; f = 11 and age = 29.3 ± 3.9 years) with fall risk event and trend interpretation tasks was conducted in an online quantitative questionnaire.
Results and Discussion
In comparision the time bar plot performed with higher accuracy (95.5%), less time (mean: 19.98±3.91 sec) and lower cognitive task load (mean score: 2.5). The time spiral plot performed with lower accuracy (77.27%), more time (mean: 28.53 ± 8.98 sec) and higher cognitive task load (mean score: 6). Overall the usage of time bar plots is preferred from participants as well as experts. Furthermore experts could see the time bar plots as a valuable addition to fall risk prevention.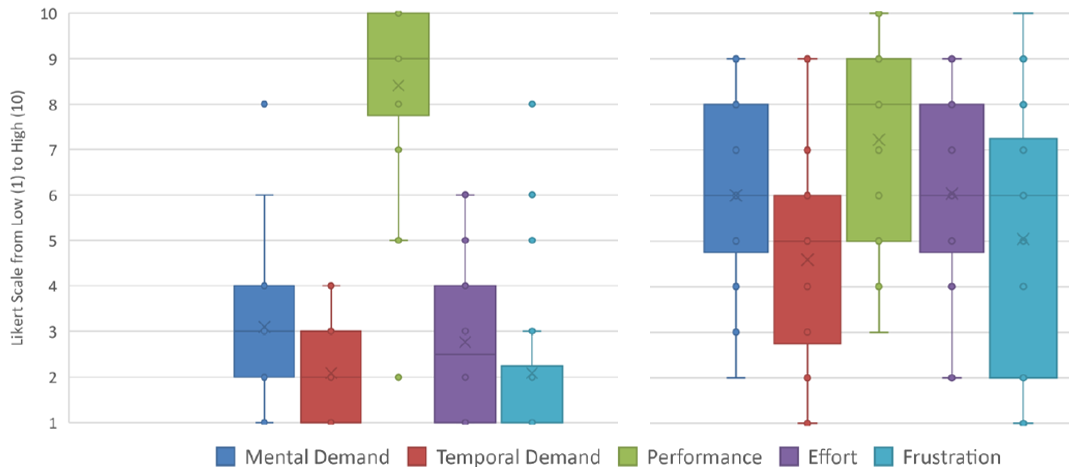 Figure 2. NASA-TLX of all Participants and all Tasks with Time Bar Plots (left) and Time Spiral Plots (right).
Conclusion
This thesis could enhance the insight on differences between time bar plots and time spiral plots for interpreting periodical time series in fall risk and potentials of visualizations for fall risk prevention. Yet furhter improvements and research needs to be done.
References
[1] Bujan et al. Die Rehabilitation 2019; 58(04), 2018. [2] López-Soto et al. Chronobiology International, 32(4), 2014. [3] Rajagopalan et al. Sensors, 2509, 2017. [4] Waldner et al. IEEE, 2019. [5] Chadwell et al. Prosthetics and Orthotics International, 42(1), 2018.